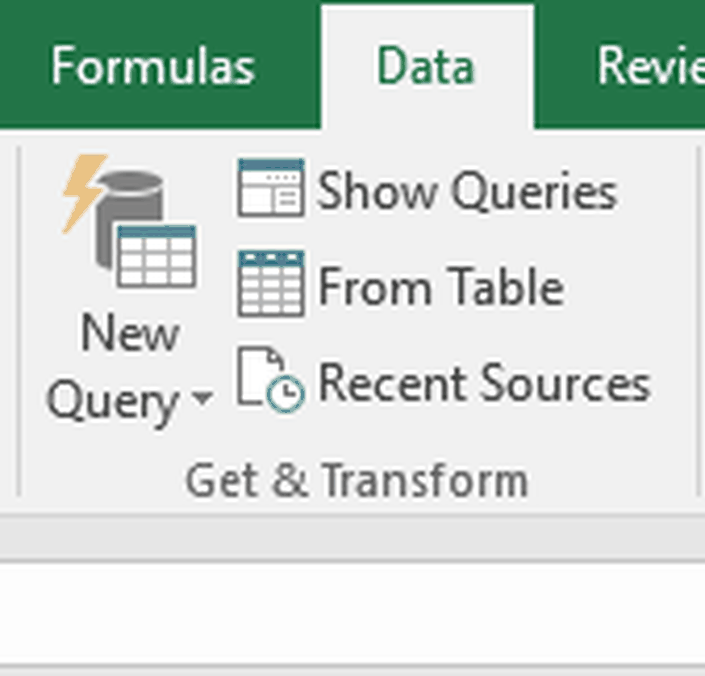
Introducing: Get & Transform
Turbo Charge your Excel Capabilities with Powerful Data Access and Analysis Features
Enroll in Course
In 2010, Microsoft introduced the "PowerQuery" add-in to Excel for accessing and integrating various types of data sources into Excel workbooks. Since then, Microsoft has created an entire infrastructure around this feature - including their stand-alone Power BI application. With Excel 2016, the PowerQuery has been integrated directly into Excel and re-branded "Get and Transform" while Microsoft continues to expand and improve upon this offering.
Do you have data that you commonly need to "fix" or "clean" because there are errors such as misspellings? Do you hire outside consultants at exorbitant rates to construct what you think to be fairly straight-forward reports, only to go through a dozen iterations and hundreds or thousands of dollars to get it right? Are you moving into the Big Data space and want to work on smaller sets of data in a more comfortable environment before moving into Power BI?
If you answered "Yes" to any of the above, this course will help you.
Across 135 minutes of instructor video with follow-up quizzes and over 10 custom exercises designed to help you apply the concepts covered in the videos, you'll learn how to pull data from multiple data sources, merge them together, apply calculations, create new results, and generate data summary reports. Along the way, you'll get a few tips and tricks to taking advantage of techniques to quickly and easily create data dashboards, re-use and expand data cleaning tools, and interact with data across sources that previously required knowledge of SQL or Access in order to create. Further, the Get & Transform tool uses the same M language used by Microsoft's Power BI, making the Excel-space an easy launching point for new data analysts.
This course will be taught using Excel 2016 but Excel 2010 and 2013 users can access all of the features involved by downloading and installing the free PowerQuery add-in from Microsoft.
Join this course and let's unlock your data potential!
Your Instructor

Philip has over 10 years of experience as an actuarial consultant for The Scruggs Group based out of Argyle, Texas.
He works on and manages a wide variety of projects ranging from mortgage insurance and workers' compensation analysis to projecting manufacturing labor requirements over a mid-term horizon. Along the way, he has acquired vast sums of knowledge about Excel, nearly a dozen different programming languages from VBA and C# to R and MATLAB scripts, and an expanse of experience mixing and matching tools to get the job done right. In addition to his consulting, we are lucky enough to have him as an instructor to discuss topics surrounding Excel and business analysis.
Beyond his achievements in the office, Philip has succeeded as a competitor in the annual ModelOff Financial World Championships. He was ranked as one of the top 50 Financial Modelers in the world following his performances in 2013 and 2014; however, he fell off the list in 2015. In 2016, Philip turned the dial up to 11 and finished in the top 20 overall and traveled to London to compete for the championship as one of four US-based competitors and re-emerged as number 23 on the Top 50.
Born and raised in Arlington Texas, Philip is a huge baseball fan and regularly roots for the hometown Texas Rangers. He attended Boston University from 2003-2006 and graduated Cum Laude with a Bachelor of Arts in Mathematics and Economics and a Master of Arts in Economics. His studies focused heavily on quantitative analysis ranging from general math studies such as differential equations and linear algebra into the more applied domains of econometrics, operations research, and game theory.
Course Curriculum
-
StartSpecial Chapter Notes
-
StartStandard Organizational Commands (8:33)
-
StartConnecting Data Together - The Append Command (6:28)
-
StartThe Append Command - Practice Set
-
StartLinking Datasets Together - The Merge Command (9:26)
-
StartThe Merge Command - Practice Set
-
StartCalculating Aggregations Across Fields - The Group By Command (10:55)
-
StartThe Group By Command - Practice Set
-
StartExpand and Contract Data - Column Pivots (10:22)
-
StartPivot Columns - Practice Set
-
StartExercise 2 Solution (13:20)